Docs
Product page
One page per product: where it's ranged, the share of stores with it in stock, its price and promos over time, and its alerts.
Availability Every plan. How far back the charts go depends on your plan's history.

The header#
The first line under the name gives the pack size and where it's ranged: "500 g · Ranged in 1,651 of 2,286 Coles, Woolworths and IGA stores (ranging not read at 234 more)". It's a plain count, never a share of shelf. Stores whose ranging we have no reading of are counted apart, never as not ranged.
The buttons:
- What changed: every change on this product between two dates. See What changed.
- Stores: the Stores list for this product only.
- Send to a colleague: email it to someone on your team. See Send to a colleague.
- Alert me: set an email alert on this product. Once it has alerts, the button reads Alerts and the number set. See Alerts.
- Export: a PDF of the page. For your own product, the PDF adds its ranging history, a row a week (further apart on a long range). See Export.
The numbers#
| Number | What it is |
|---|---|
| Stores ranged | Stores that range it, out of those whose ranging we read. At a chain whose ranging isn't read, such as Chemist Warehouse, it says so. |
| In stock | The share with it on the shelf, of the stores whose stock we read. Under it: how many stores were read ("of 412 stores read"). At a chain whose stock isn't read, such as IGA, it says so. |
| Median shelf price | The middle shelf price across the stores that sell it. At a chain with one price everywhere it says "Same price at every … store", and at one priced by state, "… prices by state". |
| Stores on promo | Stores where it's on promotion now. "Not read at Bunnings" where the chain's promotions aren't read. |
If stock was read at fewer than half of the stores carrying it, In stock is greyed and marked partial, with the count. See Metrics.
On promo now#
When the product is on promotion, a panel under the numbers shows each chain's deal: how deep it is (such as "30% off"), the promo price and the usual price, how many stores are running it, and since when. "Since … or earlier" means it began before the history you can see. There's no end date: a promotion shows until it's gone from the shelf.
The charts#
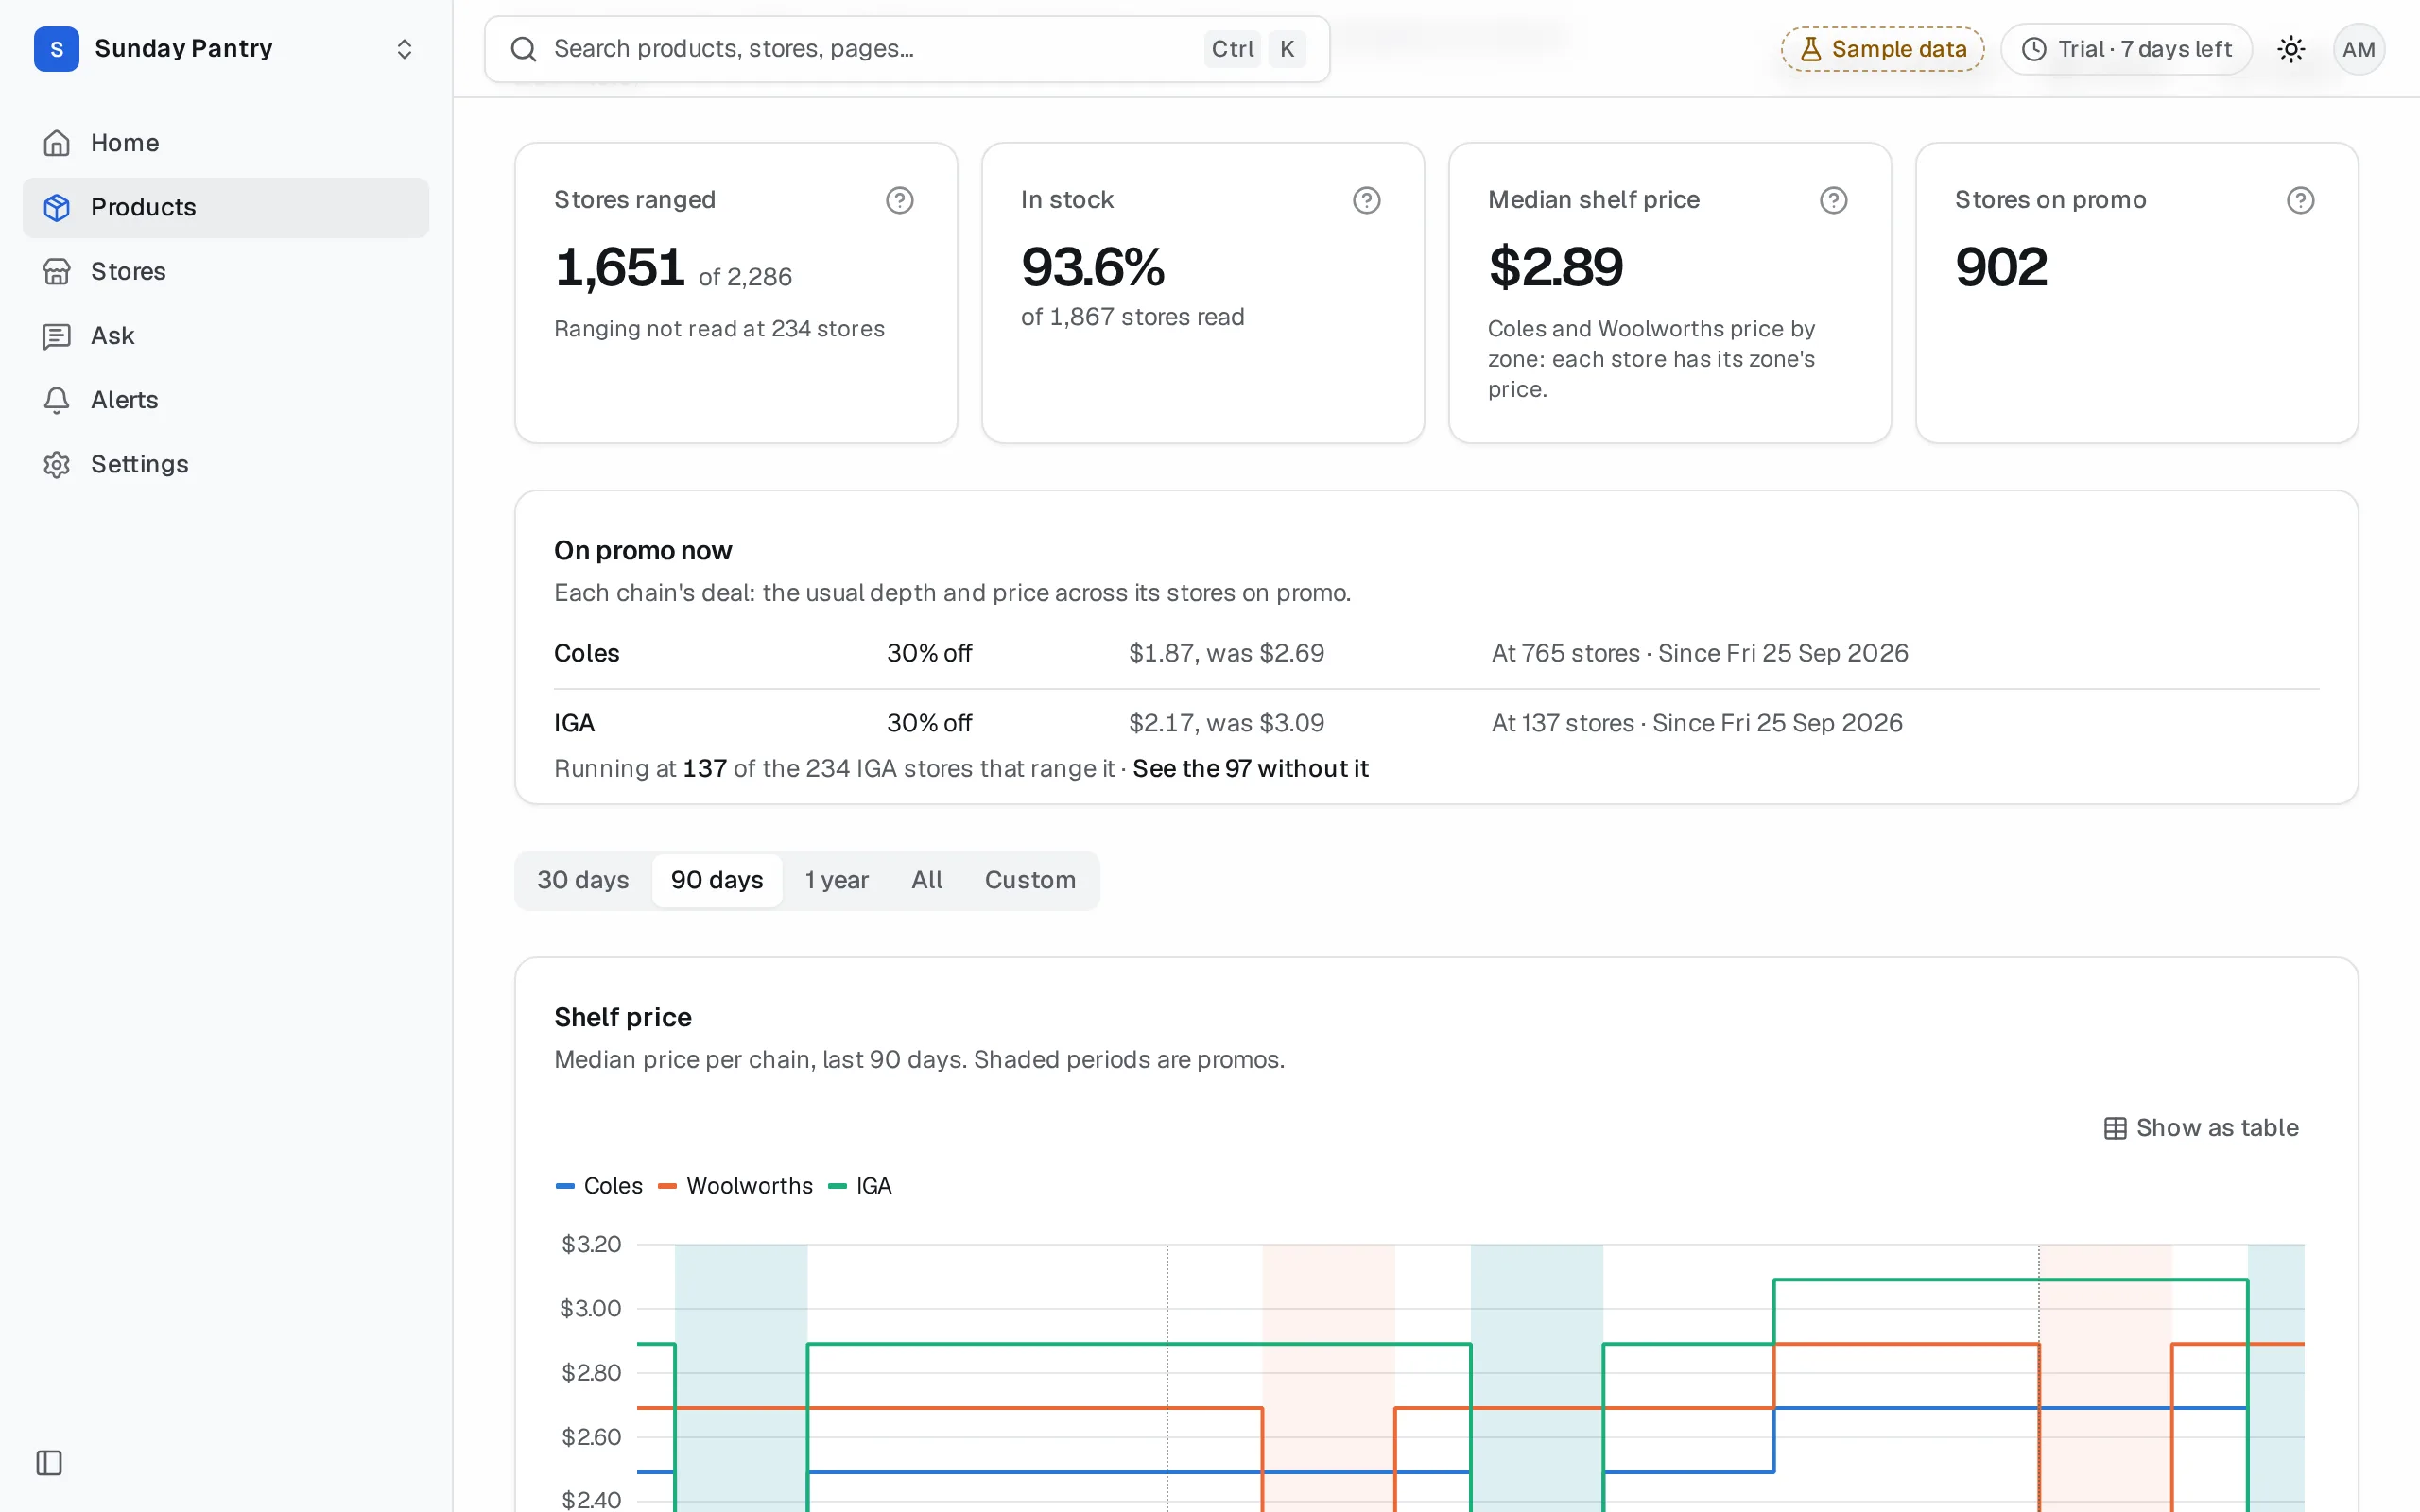
Pick a range with 30 days, 90 days, 1 year, All or Custom.
- Shelf price: the median price per chain, one line each. Shaded periods are promos, so the chart doubles as the product's promo calendar.
- Stores carrying it: how many stores range it, per chain, each day. For a new product, this is its launch curve. See Track a launch's ranging.
Click Show as table above a chart for the same numbers as a table you can read with a screen reader or copy.
Dotted lines mark days where a change may show a day late. A chain whose ranging isn't read at most of its stores is left off the ranging chart on those days, rather than drawn near zero, and the chart says so.
Did the other chains follow?#
For a product matched at other chains in your plan, a panel under Shelf price lists its price rises, cuts and promo starts in the chart's range, and whether the same product at each other chain moved the same way within 14 days: "Coles followed 7 days later (Wed 7 Oct): price rise +7.0%, $15.65 to $16.75 · national", "moved the same day", "moved first, 3 days before", "didn't move within 14 days", or "hasn't moved yet (5 days so far)". See See whether the other chain followed a price move.
Against rivals and at other chains#
Under the charts, two panels set the product beside what it's up against.
- Against rivals at Coles (the product's own chain; on a rival's page, Against your products at Coles): the rivals you watch in its category, the closest pack size first, then the chain's house brand and other brands a shopper could buy instead. On a rival's page, your own products come first.
- At other chains: the same product at the other chains (matched by barcode where both chains publish one, otherwise by name), each chain's house brand (its value or standard range, with a premium or organic range shown apart), and the best other-brand equivalent.
Each row shows the shelf price, the price per unit, the gap to this product, and its promo this week ("New this week · 30% off", "On since Wed 7 Oct", "Ended Tue 13 Oct"), counted the way Promo week counts it.
We only set two numbers side by side when they were measured the same way:
- Price. The same pack is compared on its shelf price. A different pack is compared per unit (per 100 g, per kg, per 100 ml, per litre or per metre), and only when both are fixed sizes in the same measure, less than four times apart. Products sold by weight, a 90 g pot against a 1 kg tub, and prices in NZ$ against $ are never compared. The row says why instead.
- Ranging and stock against a rival at the same chain are counted only at the stores where both were read, within a week of each other, and only where at least 5 stores qualify: "Ranged in 513 of the 876 stores both are read at (this product 743)".
- Across chains, ranging and stock are each chain's own and are never shown as a gap. The line "Ranged in 92% of Coles stores and 38% of IGA stores read" names only chains that read ranging at every store. Woolworths and ALDI read it at a sample of stores, so they're named apart.
A chain outside your plan shows only its name and "isn't in your plan", and isn't in the ranging line. On an equivalent not on your list, Watch as rival adds it as a rival. The same product at another chain has an add button that keeps this product's role.
Prices over time and by state#
- The price chart. Above the rows, a chart sets this product's shelf price (the solid line) beside each rival you watch at the chain (dashed), each one's median across the chain's stores, day by day over the range picked above the charts. All lines are on one basis: shelf prices, or per unit on this product's pack (such as per 100 g) when any rival's pack needs it. A rival whose price can't be compared isn't drawn, and the line above the chart says why. Show as table gives the same numbers.
- Price by state. Under each row at the same chain, each state's median shelf price for both products, at the stores where both are priced and read within a week of each other, with the gap and the number of stores. A state shows only with 5 such stores or more. Promo prices count as they were on the shelf. When no state has 5 such stores, the row says it isn't compared by state. Woolworths, Chemist Warehouse and Mitre 10 have one national price, so there one line above the rows says the gap is the same in every state.
In the PDF, the rivals panel is left out, and At other chains shows only this product's own listings at the other chains, not rivals, equivalents or house brands.
Use it to#
- Prepare a price conversation. See whether you're dearer per 100 g than the rival on the same shelf, whether the gap is a promo this week or the everyday price, and in which states it's widest (Price by state).
- Check the house brand. See how far the chain's own brand undercuts you, at your chain and at the others.
- Spot a ranging gap. At the same stores, see where a rival is ranged and you're not. Then use Stores filtered to Rival carried, you're not for the list.
Range clusters at Coles#
On Growth and up, a product's page shows Range clusters at Coles: the groups of stores Coles ranges the product's category by. For each group, it shows how widely your product is ranged there, and how widely your most widely ranged rival is.
Range gap marks a group where the rival is ranged at most stores (80% or more) and your product at very few (under 20%). That's a range gap you can take to the buyer. Click See where you're missing to list those stores.
On other plans, the section says how many groups there are, and whether a rival is in one you're missing from.
What it can't tell you#
- The rivals are the ones you watch. Add rivals on Products to see them here. Equivalents and house brands come from our product matching, which can miss.
- The price is the median across stores. To see the price at each store, or by state, use the Stores list for the product. See Find where your price is out of line by state.
- History starts on the first day we read the chain, and your plan may show less. See History.
Was this page helpful?
Updated 9 October 2026